ISO 30422 Explained: L&D as a Loop, Not a Deliverable
By Mark Diaz |
A lot of L&D still runs on a simple pattern: a stakeholder asks for training, we build it, we track completion, we move on.
ISO 30422 treats learning and development as a managed system, not a production line for courses. The core idea is straightforward: if L&D exists to support organizational goals, then it should run on a repeatable cycle with clear inputs, deliberate execution, evidence, and continuous improvement. Not “we delivered training,” but “we improved capability and performance, and we can show it.”
The infographic below simplifies the Plan-Do-Check-Act loop. It lays out L&D as a lifecycle: identify needs, plan the approach, deliver using methods that fit the job, measure what happened, then improve what you do next.
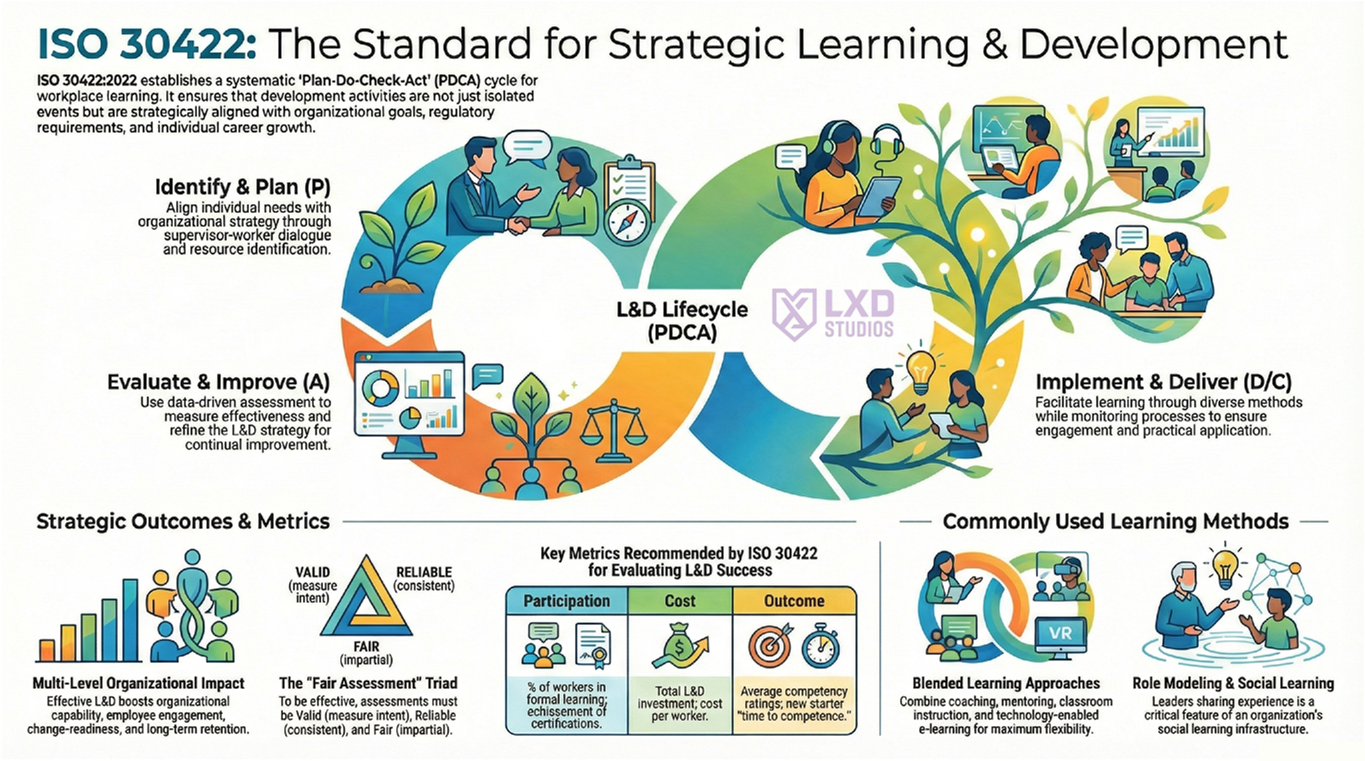
The lifecycle: what “good L&D” looks like in this model
1) Identify and Plan
This step is where L&D earns credibility. It starts with the work, not the content.
- What is happening in the job today that should not be happening?
- What should people do differently, and under what conditions?
- Who is affected, and what does “good” look like in observable terms?
- What constraints will shape the solution (time, tools, workload, risk, environment)?
A lot of L&D skips this and jumps straight to “build a course.” ISO 30422’s framing makes that harder to justify because the output is not training. The output is improved capability.
2) Implement and Deliver
In the infographic, delivery is treated as implementation, meaning the method should match the need.
Sometimes formal training is the right call. Often, it is not the only call. The methods implied by the infographic include blended options like:
- on-the-job practice
- coaching and mentoring
- leader role modelling
- peer support or buddy systems
- short guided sessions paired with field application
- digital modules used as reinforcement, not the whole solution
The point is not variety for variety’s sake. The point is fit. If the work is hands-on, performance-based, or high-risk, the learning approach needs practice and feedback, not only exposure.
3) Check: assessment quality that holds up
The infographic calls out a “fair assessment triad”:
- Valid: measures the capability that matters
- Reliable: consistent results, not dependent on who is scoring
- Fair: minimizes bias and subjective judgment
This is a useful anchor because it forces a basic question: what counts as evidence?
A multiple-choice quiz can check recall. It usually cannot confirm job performance. If the goal is performance, evidence should look like performance. That can be a short skills demo, a scored scenario, an observation checklist during a real task, role play, or a simple simulation. It does not need to be fancy, but it needs to be credible.
4) Act: improve the system, not just the slide deck
The last step is often treated like a wrap-up report. In this model, it is an improvement step.
- What worked well enough to keep?
- What failed or produced weak results?
- What should change next cycle: the method, the practice design, the manager support, the assessment, the reinforcement?
This is where L&D stops being “a project” and starts being “a system.”
Metrics: the infographic’s quiet challenge to L&D dashboards
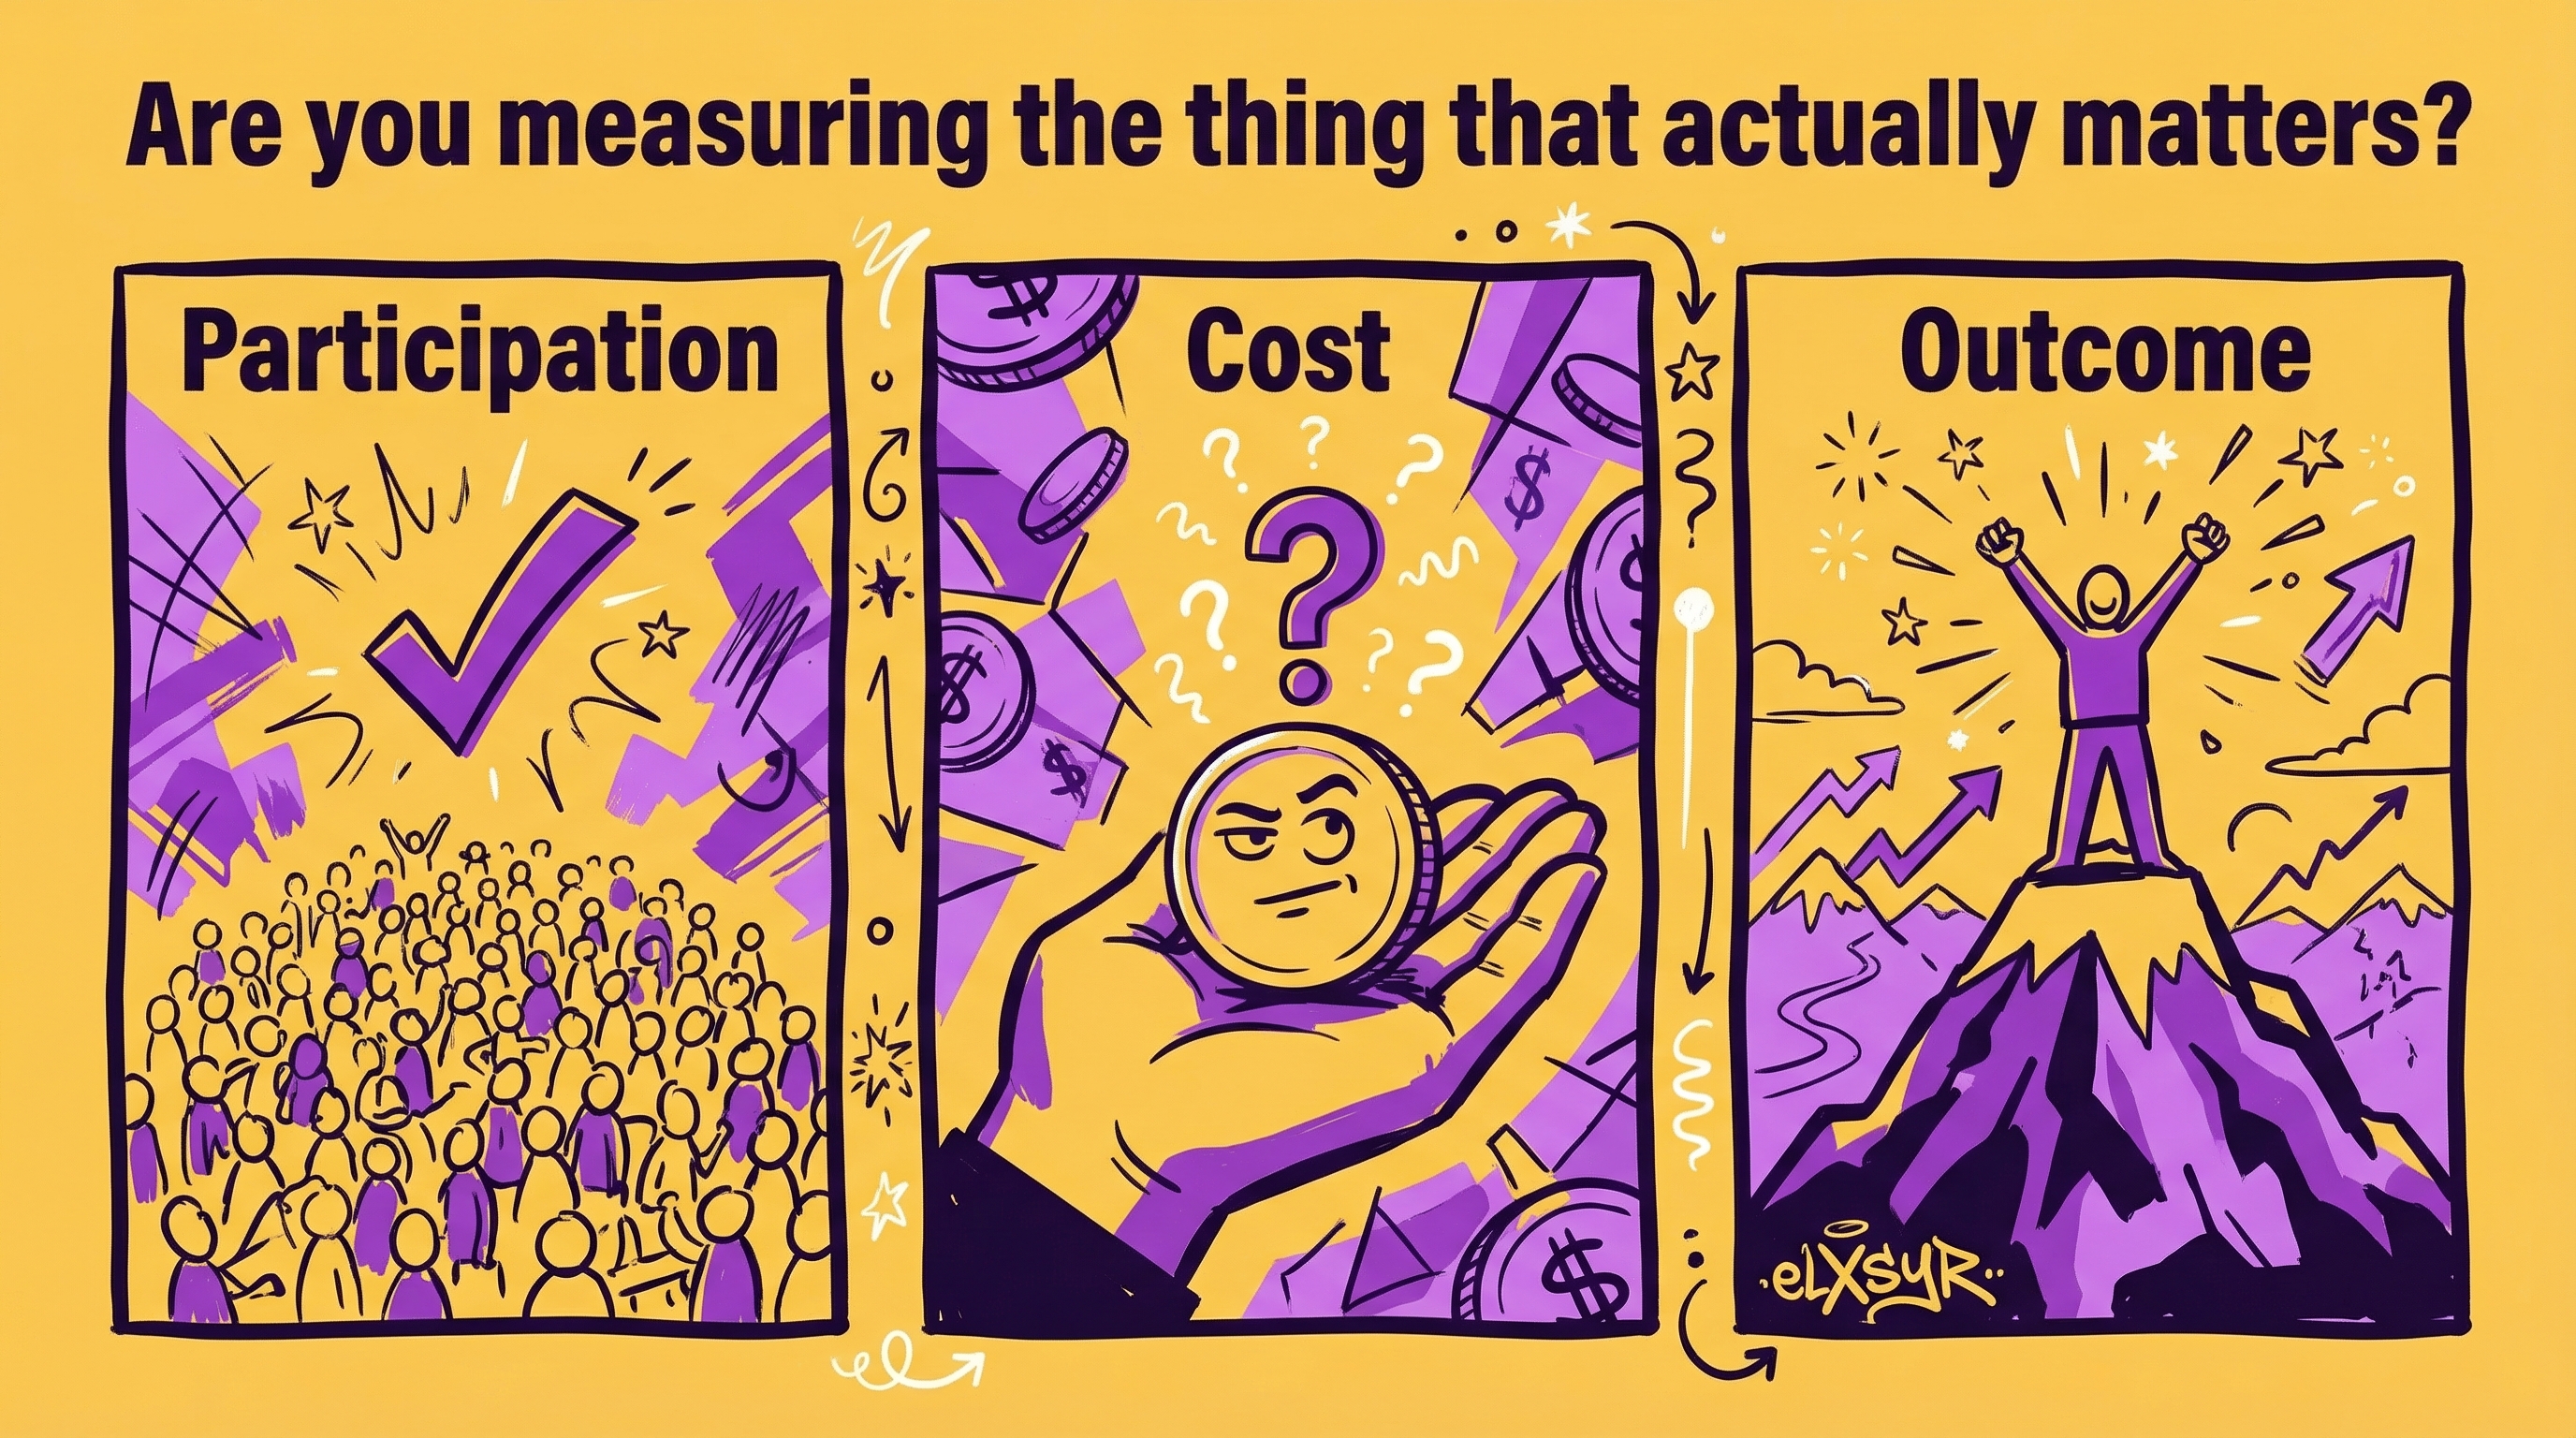
The infographic groups metrics into three buckets:
Participation
Completion, attendance, engagement, coverage.
Cost
Time, tools, vendor spend, cost per learner, opportunity cost.
Outcome
Capability and performance changes: time-to-competence, quality scores, fewer errors, reduced rework, fewer escalations, better customer outcomes, safer behaviors.
Participation and cost are operational metrics. Outcome is the value metric.
This is where the standard challenges a common norm: reporting activity as if it equals impact. Completion is not meaningless, but it is weak evidence on its own. If performance stays the same, a clean completion rate is basically a vanity number.
What this model changes in everyday L&D work
- Intake becomes diagnosis
Requests get translated into a performance target and a business reason. - Solutions expand beyond courses
The default tool becomes “the right method,” not “the course.” - Assessment becomes evidence, not formality
You decide what proof looks like before you build. - Evaluation becomes a feedback loop
Measurement is used to improve future iterations, not just to justify past work.
A lightweight way to apply ISO 30422 without adding bureaucracy
Use this as a minimum standard on the next project:
- Define one performance outcome in plain language.
- Add one practice activity that resembles the real job.
- Add one performance-facing check, not just recall.
- Track one outcome metric after rollout.
- Make one improvement based on what you saw.
That’s the whole cycle in a manageable form, and it aligns closely with how the infographic frames the standard.